East side story: mapping Bristol

What can we learn about the evolution of neighbourhoods from historical maps? And why is the east side of a city often poorer than the west?


Author: Yanos Zylberberg

A striking feature of cities around the world is the large disparity in neighbourhood composition – who lives where – often reflecting long-term segregation. Bristol is no stranger to these extreme inequalities with the deprived neighbourhoods of Barton Hill or the Dings just a few miles from the affluent Clifton neighbourhood. New techniques to digitise the information contained in historical maps of the city can help us understand the how different neighbourhoods have developed, and why such inequalities are so persistent.

What can we learn about neighbourhoods in Bristol from historical maps?

During the first half of the nineteenth century, the Great Western Cotton Factory opened the Barton Hill Cotton Mill in the Barton Hill district, most likely due to the easy access to waterways. The large factory attracted poorer workers from the rural hinterlands, sometimes from much further north. The factory polluted the local area, as did the surrounding chimneys of other factories, foundries and tanneries. At the beginning of the twentieth century, the Barton Hill Cotton Mill was still operating; the neighbouring areas had however experienced a prolonged decline in living standards from the dismal environmental conditions, the low quality of public amenities such as schools, the systematic flight of richer residents to other areas, and the mirroring arrival of poorer migrants.

The Barton Hill Cotton Mill (Bristol City Council Museums)

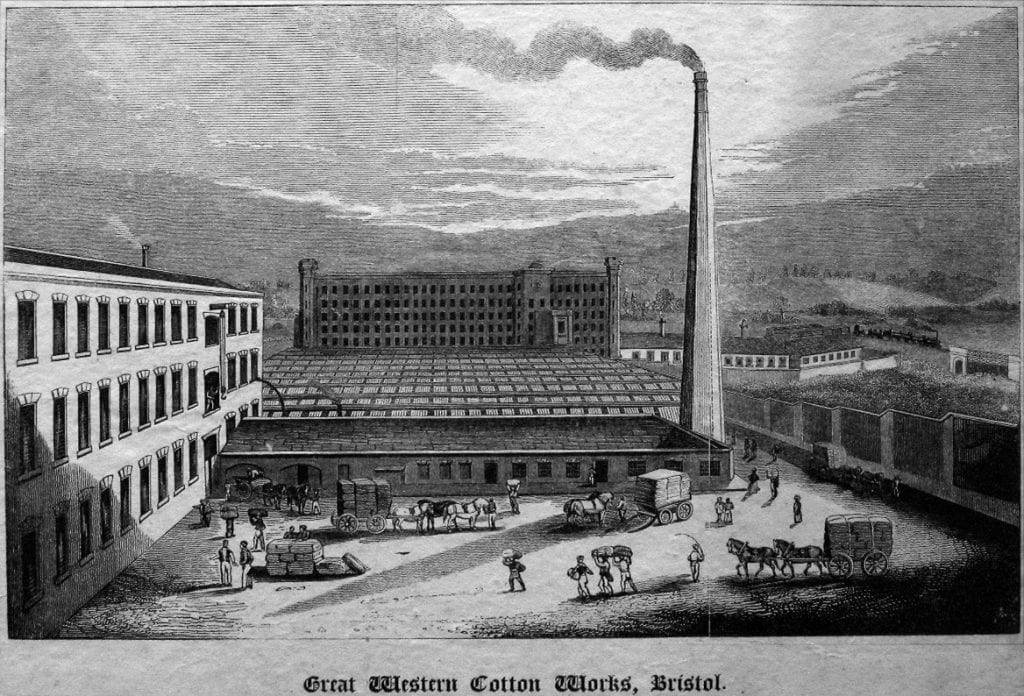
The Great Western Cotton Factory was liquidated in the 1920s, leading to a further decline of the Barton Hill area over the twentieth century. This decline was hardly mitigated by the destruction of the factory and the subsequent land remediation, slum clearances, and other, numerous urban renewal policies. By contrast, the hillside settlement of Clifton remained the richest part of town for the past two centuries, mostly unaffected by the successive transformations of the city through industrialisation, war bombings, and then deindustrialisation.

Why are the east sides of cities poorer?

This story of industrialisation, migration from rural to urban areas, inequalities existing alongside disparities in environmental conditions, neighbourhood segregation and (mostly ineffective) urban policies has not only shaped Bristol, but many British cities. One clear illustration of these underlying forces is the east to west – poorer to richer – pattern of neighbourhoods which can be observed across many cities that were formerly heavily reliant on industry. For example, the east sides of London and Manchester, and internationally, New York City or Paris are notoriously poorer than their west sides. The main mechanism at play is reminiscent of the ‘Barton Hill story’: the prevailing winds, from west to east, meant that the atmospheric pollution from coal-burning factories was mostly driven towards the east side of the city, leading to residential flight by those who could afford it, which still persists today.

While this story of disparities within cities appears to be straightforward and simple, in fact it is not, and many different factors underlie the evolution of different areas. For example: city residents, including migrants, will care about exposure to environmental pollution to different degrees and have different means of escaping it; the cost of land in different areas can lead to factories increasingly concentrating in (cheaper) polluted areas; people who work in these industries may want to live nearby due to a lack of commuting options despite the worse amenities. Large-scale changes will also play a role over time: environmental effects on surrounding areas through the conversion of farmland to built-up land; the invention of the steam engine and improvements in public transport enabled a greater division of areas into purely residential versus commercial; and slum clearances, war bombings, social housing policies, and gentrification can further tilt the trajectory of neighbourhoods.

How to turn maps into data

Figure 2: The Barton Hill Cotton Mill in the 25 inch to the mile Ordnance Survey maps.

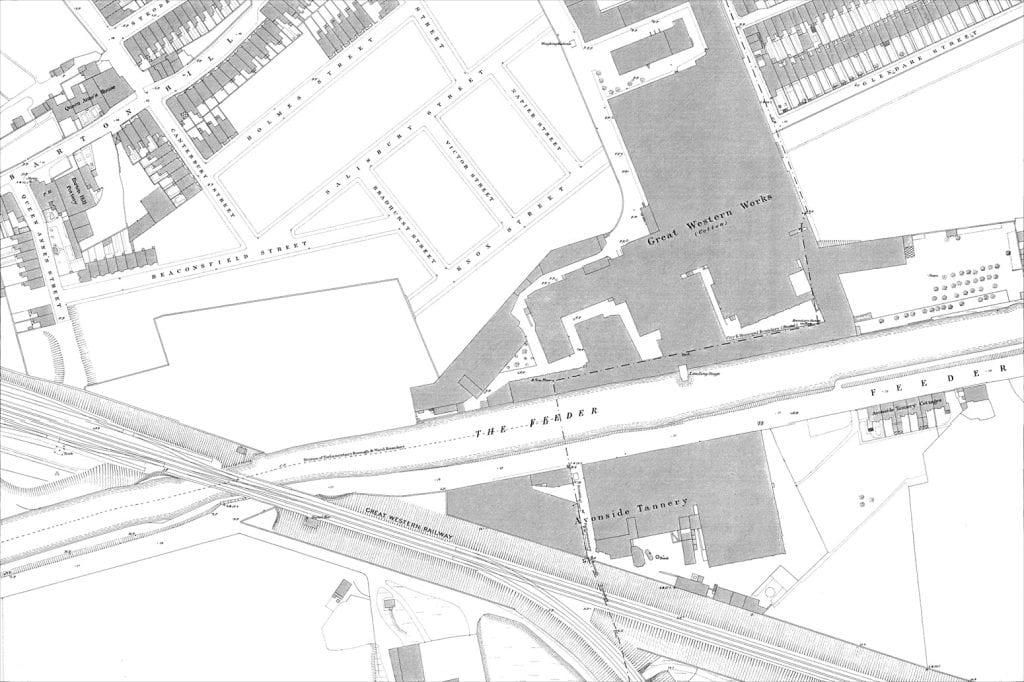
Our research takes a new approach to try and shed light on these mechanisms – using maps. We are generating unique data capturing the structure of cities combining information from local-level historical Census records capturing the characteristics of residents and workers and data derived from historical maps – the 25 inch to the mile Ordnance Survey maps covering England and Wales. These maps were produced at irregular intervals (approximately every twenty years) between 1880–1960, and were sufficiently precise to report detailed features such as industrial chimneys, lamp posts, or even the structure of gardens for the villas of affluent neighbourhoods – a reminder of the fastidiousness of early Victorian mappers. These maps have the potential to capture a comprehensive, changing image of the city, just like Google Maps does today.

Digitising these historical maps presents challenges. They are essentially a collection of highly unorganised information: writing, symbols, lines/segments, or coloured/striped surfaces, which have to be interpreted and converted into data. To do this, the research is using methods that rely on the latest innovations in visual recognition and machine learning to identify a collection of features that are important to understand the location of production, public amenities, and housing – e.g., industrial chimneys, factories and their names, market halls, corn exchange, schools, theatres, prisons, churches, union workhouses, roads and their names, train stations etc.. The resources produced can then be used by those interested in urban development to better understand the trajectory of their cities and how early policy decisions can leave an imprint in the very long run.

The project will create an interactive map of Bristol which combines the information drawn from the analysis of the historical maps – pollution imprints, neighbourhood composition and urban renewal activities – with oral histories from two Bristol neighbourhoods, Barton Hill and the Dings/St Philips. The data on industrialisation, pollution and slum clearances will also be added to the website “Know Your Place” and help connect it to communities for urban planning. More Broadly, the resources can be used to inform policy decisions through a deeper understanding how different neighbourhoods have developed, and why inequalities are so persistent.


Gender Stereotypes See Female Criminals Fare Better in Court

Michelle Kilfoyle and Arnaud Philippe
17 November 2021

The criminal justice system represents a rare sector of society where women fare better than men. Female criminals are less likely to be arrested, sent to court and sentenced than male offenders, even for equivalent crimes. Where women are sentenced, their punishments are usually less severe.

New research concludes that the differences in sentencing for men and women are due to gender stereotyping of defendants in court. Protective, paternalistic attitudes of male judges towards female defendants seem to be a key reason for the more lenient punishments handed to women.

Official statistics from France, the UK and the USA all show the preferential treatment of women throughout the criminal justice system. The new study, by Arnaud Philippe of the University of Bristol’s School of Economics and Centre for Evidence-based Public Services (CEPS), draws on criminal court data to both confirm and quantify genuine differences between sentences for men and women in France, and to find reasons for this gender gap.

Philippe analysed data for 1.37 million convictions in France between 2000 and 2003 for a criminal category called delits in French. This covers most forms of crime: property crimes, violent crimes, economic crimes, insults, drug-related crimes and road-related offenses.

The average prison sentence for men was 47 days, and 19 days for women. Having accounted for the influence of non-gender factors on sentencing, such as the form of crime, the defendant’s history of criminal activity and their socioeconomic characteristics, the study found that gender was responsible for a 15-day difference in sentence lengths for men and women. Women were also slightly more likely to receive suspended prison sentences.

Digging deeper into the data, Philippe homed in on court cases featuring just two people on trial, one man and one woman, convicted of the same crime. This enabled an even clearer picture of just how gender influences sentencing when other factors are equal, in particular, the judges and prosecutor working on the trial, and the trial’s time and place.

The sentencing gender gap was even more striking for these 2382 mixed-gender pairs. Women’s prison sentences were, on average, 25.6 days shorter than men’s and their probation sentences 2.4 days shorter. Men received longer prison sentences even if their female partner had a longer history of committing crimes – a factor normally associated with harsher sentencing.

Notably, the differences between sentences for men and women were smaller in trials with more female judges in court. Three judges work on each court case for delits, and an increase in the share of female judges of around 20% was associated with 1.5 days longer prison sentences for women, and 1.7 days longer probation. The gender of the prosecutor had no influence on sentencing rates or harshness.

The study’s findings suggest that gender stereotyping by judges was the main driver of the sentencing gender gap. Drawing on wider evidence from the US, Philippe points to the influence of paternalism among male judges, who may view women as fragile and perhaps less able to cope with prison.

These results reflect a common pattern in society whereby individuals tend to discriminate less against people of a similar demographic to themselves. In this case, female judges were less likely to positively discriminate towards female criminals.

The results do not support other possible explanations for the disparities, such as the need to adhere to the criminal code. This might, conceivably, see mothers treated less harshly for their

children’s sake as part of judges’ obligations to protect society, for instance, but this was not shown by the data.

As well as providing clear evidence of discrimination between men and women in court, the study also demonstrates the broader value of diversity among decision makers in reducing discrimination


Michelle Kilfoyle – CEPS Science Writer
Arnaud Philippe – Senior Lecturer, School of Economics

Study Counts Devastating Toll of Domestic Violence Faced by Mothers on Their Children

Study Counts Devastating Toll of Domestic Violence Faced by Mothers on Their Children

Michelle Kilfoyle and Zahra Siddique – 18 October 2021

Described as the ‘Shadow Pandemic’ by the UN, the global rise in domestic violence against women since the onset of the Covid-19 pandemic is a huge cause for concern. New research further emphasises the urgent need to tackle domestic violence by exposing the scale of its devastating effects on the children of women who suffer at the hands of their partners. The large-scale study, which draws on data from half a million families across the developing world, finds that children born to victims of domestic violence are more likely to die by the age of five than children of mothers who do not. Further, women who experience violence endure more stillbirths.

Even before the pandemic, 1 in 3 women across the world experienced physical or sexual violence mostly by an intimate partner, with rates particularly high in developing regions such as Central sub-Saharan Africa (65.64% of women) and South Asia (41.73%). In 2020, the UN estimated that global cases rose by 20% during lockdown.

This study provides further evidence on the costs of domestic violence by highlighting the damage inflicted upon the wider family, specifically children. Zahra Siddique of the University of Bristol’s Centre for Evidence-based Public Services (CEPS) in the School of Economics, in collaboration with Samantha Rawlings of the University of Reading, analysed the results of 54 Demographic and Health Surveys (DHS) carried out in 32 developing countries between 2000 and 2016.

Collectively, these surveys interviewed around 500,000 women aged 18 to 49 on issues including domestic abuse, births and deaths of children, and pregnancy loss. Interviewers used robust protocols to help participants feel safe and comfortable and maximise the honesty of responses. Twenty-nine per cent of the women reported experiencing physical abuse at some point in their life , while 9% reported experiencing sexual violence.

A host of factors lead to higher death rates among children of mothers who have experienced domestic abuse. In developing countries, families with abusive members tend also to be poorer and less well-educated; all these factors heighten the risk of children dying.

However, Siddique and Rawlings’ research methods allowed them to disentangle the effects of these factors to put precise figures on the damage inflicted by domestic violence alone.

Death rates within the first 30 days of life for children whose mothers experienced physical abuse were 3.7%, compared with 3.0% for children of non-victims. Siddique and Rawlings attribute a significant fraction of this difference – 0.4 percentage points – to the physical abuse. This accounts for around 4,500 deaths among the 1.14 million babies included in this part of the study.

Further, children of domestic-violence victims were 0.7 percentage points more likely to die within a year, and 1.0 percentage points more likely to die within five years of being born. This means that domestic violence led to the deaths of 7,600 babies (of 1.09 million studied) before the age of one, and 8,500 deaths (of 0.86 million children studied) by the age of five.

Most deaths occurred in families where the women experience frequent violence, as opposed to occasional violence.

Further, mothers who experience physical domestic violence were 1.4% points more likely to suffer stillbirth than women who are not victims, with a similar picture emerging for sexual violence.

To help pinpoint the impact of domestic violence on mortality rates, the researchers estimated the influence of ‘unobservables’, that is, differences in characteristics between victims and non-victims that cannot be measured in the data, but can affect mortality rates. They found that the effect of these factors would need to be much larger, by 2-3 times, to be able to completely rule out domestic violence as the cause of the deaths – giving confidence that violence did explain the higher death rates. These behaviours are likely to arise from extreme stress levels, and the study recommends deeper investigation into these factors to better understand the links between domestic violence and childhood mortality.


Michelle Kilfoyle – CEPS Blog Science Writer

Zahra Siddique – Associate Professor of Economics, University of Bristol