Why We Give to Charities and When: Fundraising Lessons From Health Scares and International Disasters

Sarah Smith and Michelle Kilfoyle
22 December 2021

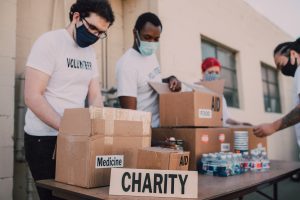
Charities have taken a huge hit in income during the Covid-19 pandemic. Social distancing has prevented in-person fundraising events, whether fun runs or cake sales, while lockdowns forced charity shops to shut their doors to customers for months at a time.

Of the funding that has made it to charities, there has been a notable shift in donations towards hospital and hospice charities, and away from non-Covid-19 causes.

Our research provides fresh insights for the charitable sector that could shape fundraising strategies and help boost income across the sector post-pandemic.

Lifting or shifting donations?

Fears circulate in the charitable sector that when we give money to one charity, it comes at the expense of donations to others. After all, there is only so much money and, perhaps, good will to go round. But is that really the case? Or can we be inspired to both give more, and give to more charities? Providing evidence from health charities and disaster appeals, research by Sarah Smith from the Centre for Evidence-based Public Services (CEPS) in Bristol’s School of Economics addresses this debate. It shows that there are instances of givers shifting their donations between different charities, and also examples where they expand the number of charities they support.

Health charity donations after severe illness

People who have survived a severe health scare are more likely to donate to related medical charities following their diagnosis, a phenomenon known as ‘altruism born of suffering’. A study by Smith and colleagues from Monash University provides evidence on the rate of its occurrence and, shows that this giving does divert spending away from non-health causes.

The research team analysed long-term data (2001-2015) on over 400 households across the US who were asked about their charitable giving and about their health.

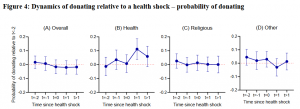
In the year following a health scare, namely cancer, a heart attack or a stroke, the probability of donating to health charities went up by 11 percentage points, that is, 41% of this group donated, compared with 30% among those who had not had a health scare. Their likelihood of donating to health charities drops as the years pass, but still remains 6 percentage points higher 2-3 years after the scare.

These donors subsequently gave less money to non-health charities – switching loyalties between good causes, but were not giving more or supporting more charities overall.

Further, the health scares rarely motivated people to give to health charities if they were not already regularly donating to charity. Only 4% of new givers to the health sector had never donated to non-health causes prior to their health shock.

Disaster relief appeal effects on total giving A separate, but related, study revealed very different patterns of giving in the case of disaster relief campaigns in the UK.

Unlike the case of health charities and health shocks, disaster relief appeals trigger a lift in overall donations. People not only give to the campaigns over and above their existing charitable donations, but also go on to donate to other charities that are quite separate to the disaster relief campaign – at least in the short term.

Smith and colleagues from the University of Birmingham and IUPUI in the US studied data on the charitable giving accounts of more than 100,000 UK people who regularly donate through the Charities Aid Foundation (CAF), covering 4.5 million donations to 80,000 charities over 2009-2014.

They focused on six major appeals launched during this time by the UK Disasters Emergency Committee (DEC), including the 2010 earthquake in Haiti and the 2013 typhoon in the Philippines.

Significant spikes in overall donations through CAF were seen after each of these appeals; of the five biggest spikes over the period, four occur after DEC appeals.

Total donations were higher for 14 weeks after each appeal, before returning to normal levels.

Strikingly, donations to other, non-DEC, charities also increased by 10% immediately after each appeal, and these all came from the same people who had given to DEC.

This donation pattern is not unique to DEC appeals. The study found similar results for major annual fundraising telethons, specifically BBC Children in Need, Comic Relief and Sports Relief, where a lift in non-telethon donations also occurred immediately after the events.

A few weeks after the DEC appeals, donations to non-appeal charities dipped below typical levels before returning to normal. However, there was no subsequent drop in donations to non-appeal charities after telethons, suggesting that the degree to which people adjust donations varies by charitable cause.

Altruism vs ‘warm glow’

Smith and colleagues explain the different patterns of charitable giving in the two studies through different motivations for giving.

Health shocks are an intensely personal experience, often life-changing, and donations to health charities are explained by altruistic motivations. The donor cares deeply about the outcomes of the charities’ activities, such as new medical treatments.

Health charities could focus fundraising efforts with patients in the first year following diagnosis, the research suggests, when the salience of the illness and sense of altruism are at their peak.

Giving to disaster appeals and telethons, on the other hand, is explained by a ‘warm glow’ effect. This is the feel-good factor we experience when we help other people. Thus, increased donations to non-DEC and non-telethon charities occur not only because the appeals have acted as a reminder to give to charity, but also because they extend that warm glow feeling.

Building on these findings, the researchers developed a model that tracks the changing influence of warm glow on giving. When the warm glow effect is high, people find giving to charities relativelyeasier, as shown by the disaster appeal research. But when it is lower, perhaps depleted after a string of donations, the cost of giving to charity feels much greater.

The model helps paint a picture of how charities influence each other’s incomes through their collective effects on warm glow and points to how they could best benefit from this. The model could, for example, identify the best timings for campaigns in relation to one another, as well as the timing or targeting of government tax incentives to encourage charitable giving


Professor Sarah Smith – University of Bristol, School of Economics
Michelle Kilfoyle – CEPS Science Writer

Genes and Upbringing Both Matter for Educational Success


Stephanie von Hinke and Michelle Kilfoyle
17/12/2021

Nature vs. nurture is an age-old debate. Are we products of our genes or of how we were raised? It is now widely accepted that both genes and environment are inextricably linked and jointly mould our lives. A recent study of siblings and their educational achievements provides evidence to further bolster this joint gene-environment theory. It finds that eldest siblings, typically blessed with extra attention from their parents, do especially well in education when they also possess certain genetic traits.

Firstborn children have the luxury of their parents’ undivided attention until the arrival of their younger siblings. In fact, firstborns can expect to have, on average, 20-30 minutes more daily quality time with their parents than laterborns, as parents find their time increasingly stretched with each child.

This privilege goes a long way in explaining why eldest siblings tend to do better at school than their younger siblings and can be seen as a form of investment by parents in their child’s future. However, it is not always the full story, as the study co-authored by Stephanie von Hinke of the University of Bristol’s Centre for Evidence-based Public Services (CEPS) in the School of Economics shows.

In an innovative step for economics, von Hinke and collaborators from Erasmus University Rotterdam used genetic data to help understand why some people do better than others in education. They analysed DNA from UK Biobank, a national repository of biological samples and individual data, for a sample of 14,850 adult siblings (aged 40-69 at the time of study).

They measured each sibling’s ‘genetic endowment’ for educational attainment using ‘polygenic scores’. These scores are based on specific genetic variants that correlate with educational attainment.

By comparing siblings from the same family, the researchers were able to cancel out the effects of factors like parental income and social class on children’s educational attainment. (It would be much more difficult to disentangle these wealth and class-derived influences from other non-genetic factors when comparing children from different families.)

Each family was akin to a controlled experiment that allowed the researchers to explore the relative influence of each child’s genetic variation and their environment. In this study, being firstborn or laterborn was used as a measure of a child’s environment as it, at least partly, indicates whether parents invested more or less time in each child.

The results first confirmed that genetic variations are very good at predicting educational attainment. In general, the higher a person’s genetic endowment, the more years they had spent in education. Firstborns were no more or less likely to have a high endowment than laterborns.

Second, the results confirmed that firstborns do better at school. Firstborns with an average genetic endowment completed, on average, an extra 4.5 months of schooling than their laterborn siblings.

However, firstborns who have an above-average genetic endowment completed, on average, an additional two months of education (on top of the 4.5 months) than their laterborn siblings with the same genetic endowment.

This study shows that neither genetics nor environment are solely responsible for determining our education, and that both matter. Furthermore, as well as emphasising the importance of investing in skills early in life, the research supports the idea of ‘dynamic complementarity’ between nature and nurture in this setting, that is the idea that people with higher initial skills benefit more from subsequent investment.


Professor Stephanie von Hinke – Professor of Economics, University of Bristol School of Economics
Michelle Kilfoyle – CEPS Science Writer

Escalating Tuition Fees in England Have Not Made Poorer Students Less Likely to Go to University

Stephanie Simion and Michelle Kilfoyle
9 December 2021

Recent UK government proposals to reform higher-education funding, under which graduates would start repaying their student loans on lower salaries, have triggered concerns around disproportionate and negative effects on lower earners. A recent study has assessed the impacts of past changes to higher-education funding for students from different income groups in England. It finds that price hikes to tuition fees in 2006 and 2012 have not led to fewer poorer students going to university due to financial support in the form of loans and grants.

In fact, it is students from wealthier families, who are less likely to be eligible for financial support, who are now slightly less likely to enrol. The reforms also appear to have had only very small effects on students’ choices of degree subject and university location, and on their short-term career prospects.

Rising tuition fees

Many countries are considering reforms to higher-education funding. England has had three major reforms in recent decades, beginning in 1998 with a switch from no fees to means-tested fees of up to £1,000 per year.

This was followed by a rapid series of changes which now see England’s students paying among the highest undergraduate tuition fees in the world at up to £9,250 a year. Only students at private universities in the US pay more.

The financial burden of tuition fees naturally raises concerns that students from poorer backgrounds will be deterred from going to university.

Socio-economic consequences The new study, by Stefania Simion of the University of Bristol’s Centre for Evidence-based Public Services (CEPS) in the School of Economics, in collaboration with Ghazala Azmat of Sciences Po in France, unpicked rich datasets to better understand the consequences of different methods for financing higher education.

The researchers assessed enrolment rates, choice of university and subject, and post-university outcomes for students who entered higher education in England between 2004 and 2013, using data on all state-school educated students – around 2.8million individuals.

Their analysis revealed the effects of the increase in fees to £3,000 per year in 2006 (up from a maximum of£1,000, depending on family income), and the short-term effects of the 2012 reform which raised fees to their present maximum level of £9,250.

Enrolment rates and financial support

Enrolment rates across all students fell slightly, by 0.5 percentage points, after the 2006 reform, and again in the year following the 2012 reform. However, this drop was largely among students from wealthier families, classed by this study as those with an average household income of £43,000 or more.

Changes in enrolment rates for students from poorer families (with an average household income of £29,000 or less) and middle-income families (average household income of £34,000) were negligible.

These results can be explained by the financial support packages that accompanied the increases in fees.

Notably, since 2006, students in England do not have to pay fees upfront but can instead take out a loan to cover the cost. They repay this with interest over their working lives and only once their salary passes a certain threshold, currently £27,295 for those who took out a loan after 2012, or £19,895 pre-2012.

On top of this, means-tested grants of up to £2,700 were introduced in 2006 (up from £949) rising to £3,250 in 2012, plus means-tested loans of up to £4,000 in 2006, and £5,200 in 2012.

This package eases the financial burden of fees, but also means that higher education is relatively more costly for students from families who do not receive means-tested support, potentially explaining the slight drop in student numbers from higher socio-economic backgrounds.

The study calculates that an increase in fees of £1,000 for wealthy students not eligible for grants corresponded to a drop in enrolment of only around 0.025 percentage points. But there was an 0.8 percentage point increase in enrolment among students who were eligible for full financial aid.

Degree subject, university location and career outcomes

The higher cost for wealthier students may also explain why the study found that they were more likely to choose a university close to home after the reforms. It may also explain a slight shift in subject choices. Post-reform, wealthier students were slightly less likely to opt for degrees in Arts and Education programmes, preferring STEM subjects that offer higher-paid careers.

These choices could translate into different career outcomes for wealthier students. Six months after graduating, they had marginally higher earnings and they were also less likely to be unemployed or in insecure work than graduates from less well-off backgrounds compared with the pre-reform period. However, average earnings for middle and low-income groups fell slightly after the reforms.

Closing the socio-economic gap in higher education

In sum, the results show that the funding reforms have had only very small effects on higher education choices, but do suggest that the socio-economic gap in university enrolment is narrowing.

The study’s authors recommend a deeper look at the data to understand if more could be done to promote university to students from the poorest backgrounds, with family incomes far below the £29,000 threshold used in this study


Dr Stefania Simion – Lecturer at University of Bristol, School of Economics

Michelle Kilfoyle – CEPS Science Writer